
- Table 1 Field staff health and safety audit findings
- Table 2 KPI performance summary, 2025 to 2026
- Table 3 Health and safety training completion rates, 2025 to 2026
- Table 4 Person-specific risk assessments by type, 2025 to 2026
- Table 5 Completion of operational health and safety reviews, 2025 to 2026
Health and safety performance monitoring
This section provides an overview of FSS's health and safety performance during the reporting period. It covers performance against KPIs and incident management activity.
Key Performance Indictors (KPIs)
FSS set leading and lagging key performance indictors (KPIs) to drive continual improvement and implement effective preventative measures. Lagging indicators are more focused on performance of dealing with incident management. The performance summary for each KPI in the 2025-26 period is provided (Table 2). Where a KPI has changed from the year before and a direct calculation for the previous year was possible then this data has been included.
Table 2: KPI performance summary, 2025 to 2026
| KPI | Description |
2024-2025 | 2025-2026 Baseline target | 2025-2026 Stretch target | 2025-2026 Actual YTD | |
|---|---|---|---|---|---|---|
| i | Office Inspections and FBO safety tours | Office inspections and FBO safety tours completed on approved premises with permanent FSS presence. | 97% | 90% | 95% | 97% |
| ii | TRIR (per 200,000 hours) | Prevent, manage, and effectively monitor injurious incidents. | 1.36 | 1.4 | 1 | 1.37 |
| iii | Mandatory HSE Training Completed | Timely completion levels of staff’s mandatory HSE Training. | 87% | 87% | 92% | 90% |
| iv | Management System Development | Annually review one third of Health and Safety Management System Procedures and update as required. | Not applicable | 85% | 100% | 100% |
| v | Risk Assessment Review | Review of live risk assessments against plan to ensure they are up to date, effective and relevant. | 95% | 90% | 95% | 92% |
| vi | Post-Incident Risk Assessment Review | Completion of relevant safety tours and risk assessment reviews following incidents. | 100% | 80% | 90% | 86% |
| vii | Incidents Reported <1 Working Day | Timescale for commencing investigation into health and safety incident reports. | 92% | 90% | 95% | 88% |
| viii | Incident Close Out Within 90 Days | Close out of incidents through implementing effective controls, following investigation. | 92% | 80% | 90% | 96% |
Notes
i. Excellent sustained performance throughout the year, exceeding stetch target.
ii. Includes Medical Treatment Cases (MTCs) Restricted Work Cases (RWCs), and Lost Time Injury (LTI) cases >1day.
iii. Exceeded target levels, reflecting positive staff engagement with health and safety initiatives.
iv. Target was met and KPI aimed at driving continued review and improvement of the safety management processes. This KPI was introduced in 2025 to 2026, so no 2024 to 2025 data is available for comparison.
v. Stretch target achieved.
vi. Target met.
vii. Missed target due to late reporting of FBO animal escapes.
viii. Exceeded stretch target.
The 2025 to 2026 KPI results demonstrate a continued positive health and safety performance. Seven of the eight KPI targets were met or exceeded. The only target not achieved was ‘Incidents Reporting <1 Working Day’. Of the 33 incidents reported, four were not reported within a working day. Of these, one was a non-work-related health issue and three were classed as Near Miss escaped animal events at Food Business Operators (FBO). FSS requires all incidents to be reported within the KPI timeframe.
Continued focus on leading indicators is essential for maintaining and further improving health and safety performance.
Incident management
Incidents are currently reported through the designated HSE incidents email. These are allocated a unique incident number to accompany the incident investigation, with the level of investigation depending on severity. Investigations aim to identify the cause(s). The investigation outcome aims to identify corrective and preventative measures to reduce the likelihood of a recurrence. Staff are also encouraged to report all Near Misses and Undesirable Events. Occurrences are categorised and rates calculated to enable performance comparisons from year to year (Figure 1).
Figure 1: Year-on-year health and safety performance, 2018 to 2026
Rates are shown per 200,000 hours worked. RIDDOR data shows the number of RIDDOR reports in each reporting year. MTC stands for Medical Treatment Case.
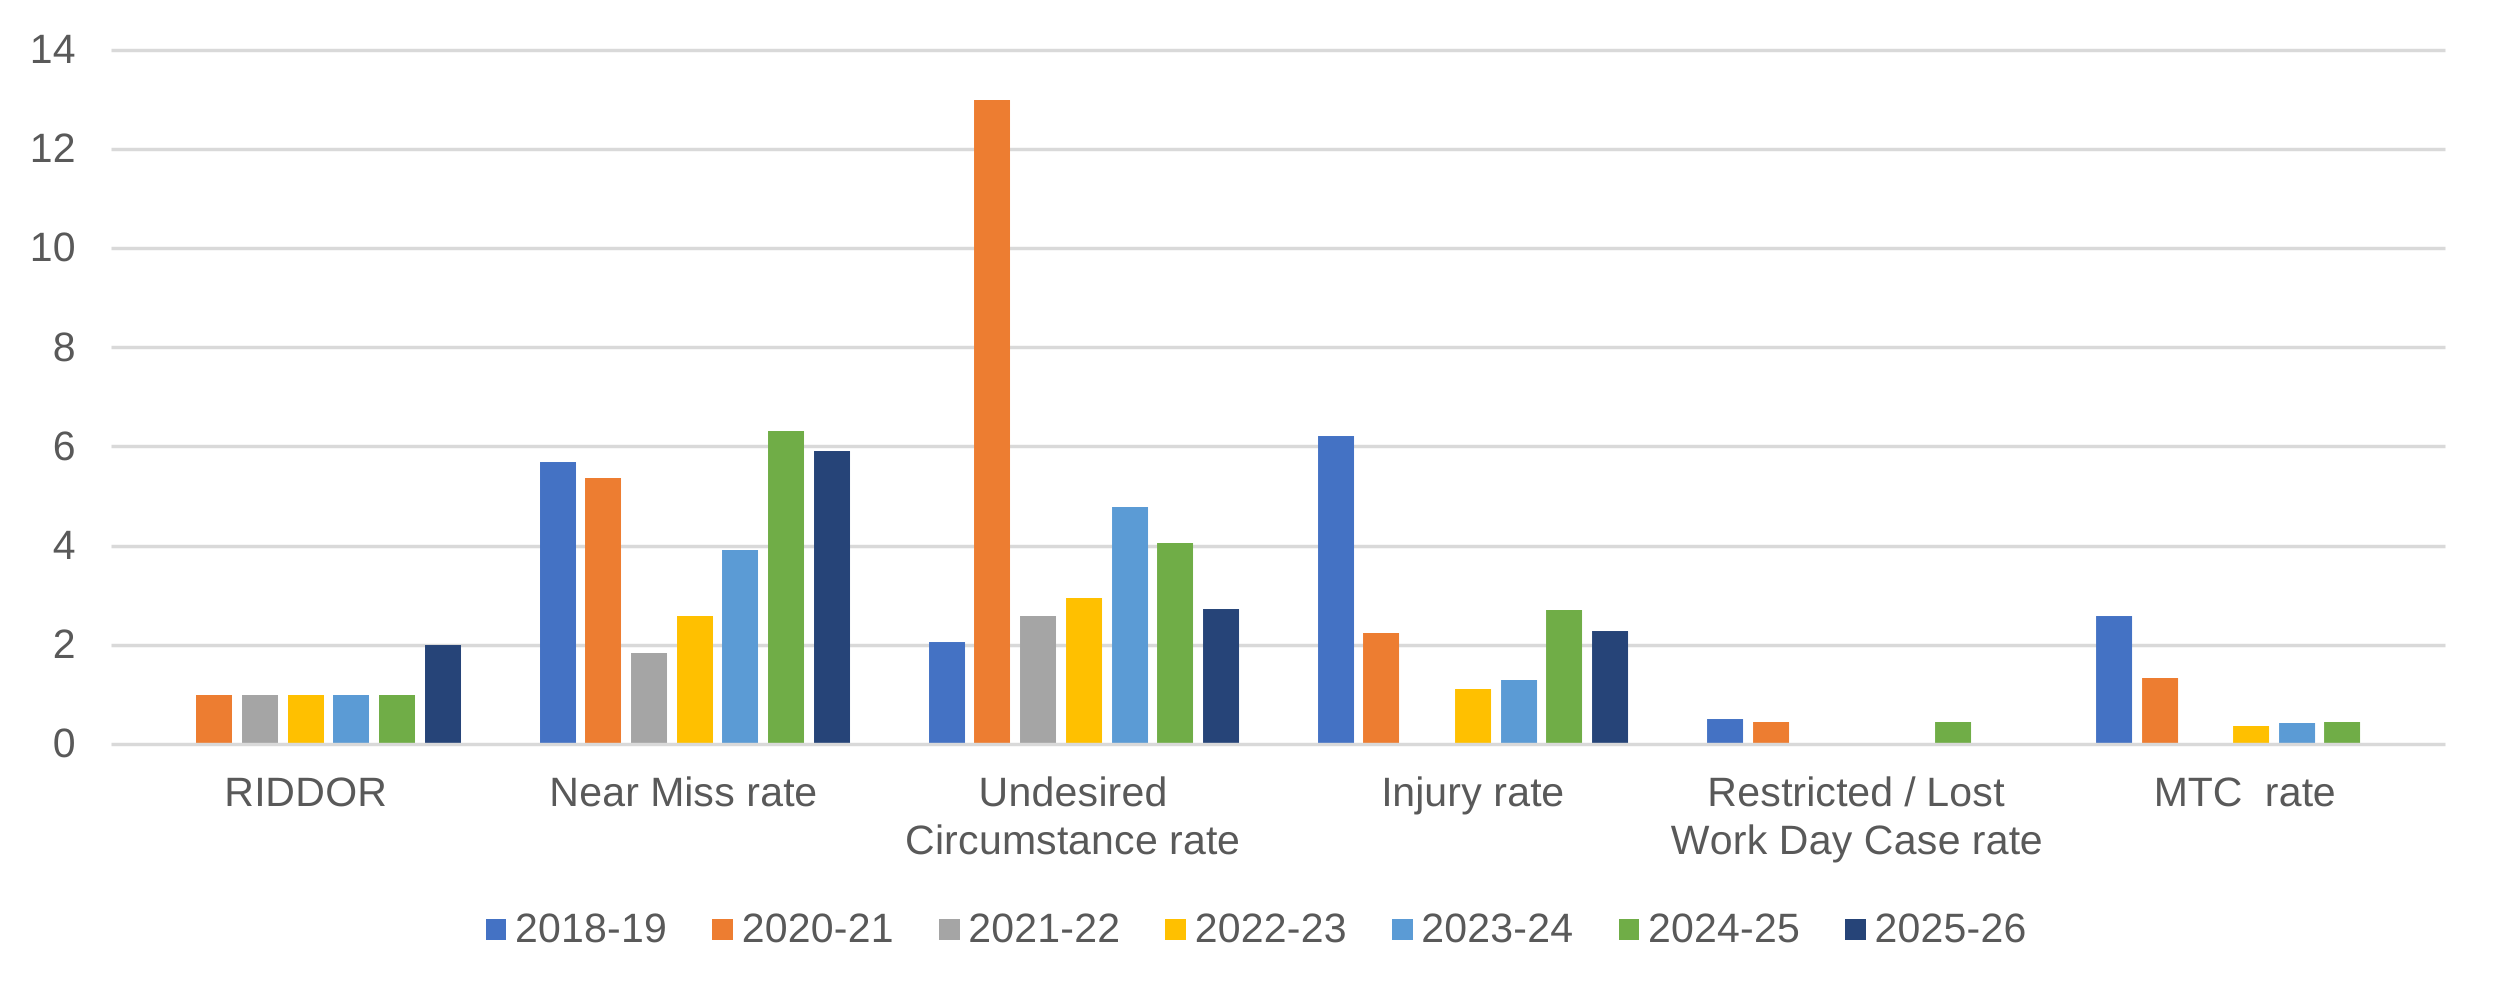
Here is a visual only chart of: Clustered column chart showing the health and safety performance for different injury categories from 2019 to 2026. In the 2025 to 2026 period, 2 RIDDOR injuries were reported, an increase of one from the previous years. The Near Miss Rate, Undesired Circumstance Rate, Injury Rate, Restricted Work Day Rate and Medical Treatment Rate were lower than the previous period.
Please find more information provided in the detailed description and/or table below.
| Metric | 2018 to 2019 | 2020 to 2021 | 2021 to 2022 | 2022 to 2023 | 2023 to 2024 | 2024 to 2025 | 2025 to 2026 |
|---|---|---|---|---|---|---|---|
| RIDDOR reports | 0 | 1 | 1 | 1 | 1 | 1 | 1 |
| Near Miss rate | 5.70 | 5.38 | 1.85 | 2.59 | 3.92 | 6.33 | 5.92 |
| Undesired Circumstance rate | 2.07 | 12.99 | 2.59 | 2.96 | 4.79 | 4.07 | 2.73 |
| Injury rate | 6.22 | 2.24 | 0.00 | 1.11 | 1.31 | 2.71 | 2.28 |
| Restricted/Lost Work Day Case rate | 0.52 | 0.45 | 0.00 | 0.00 | 0.00 | 0.45 | 0.00 |
| Medical Treatment Case (MTC) rate | 2.59 | 1.34 | 0.00 | 0.37 | 0.44 | 0.45 | 0.00 |
Note: Rates are shown per 200,000 hours worked. RIDDOR data shows the number of RIDDOR reports in each reporting year. MTC stands for Medical Treatment Case.
Figure 2: Total Recordable Injury Rate (TRIR), 2018 to 2026
The Total Recordable Injury Rate is a standard calculation [TRIF = (Number of injuries x 200,000) / (number of hours worked)].
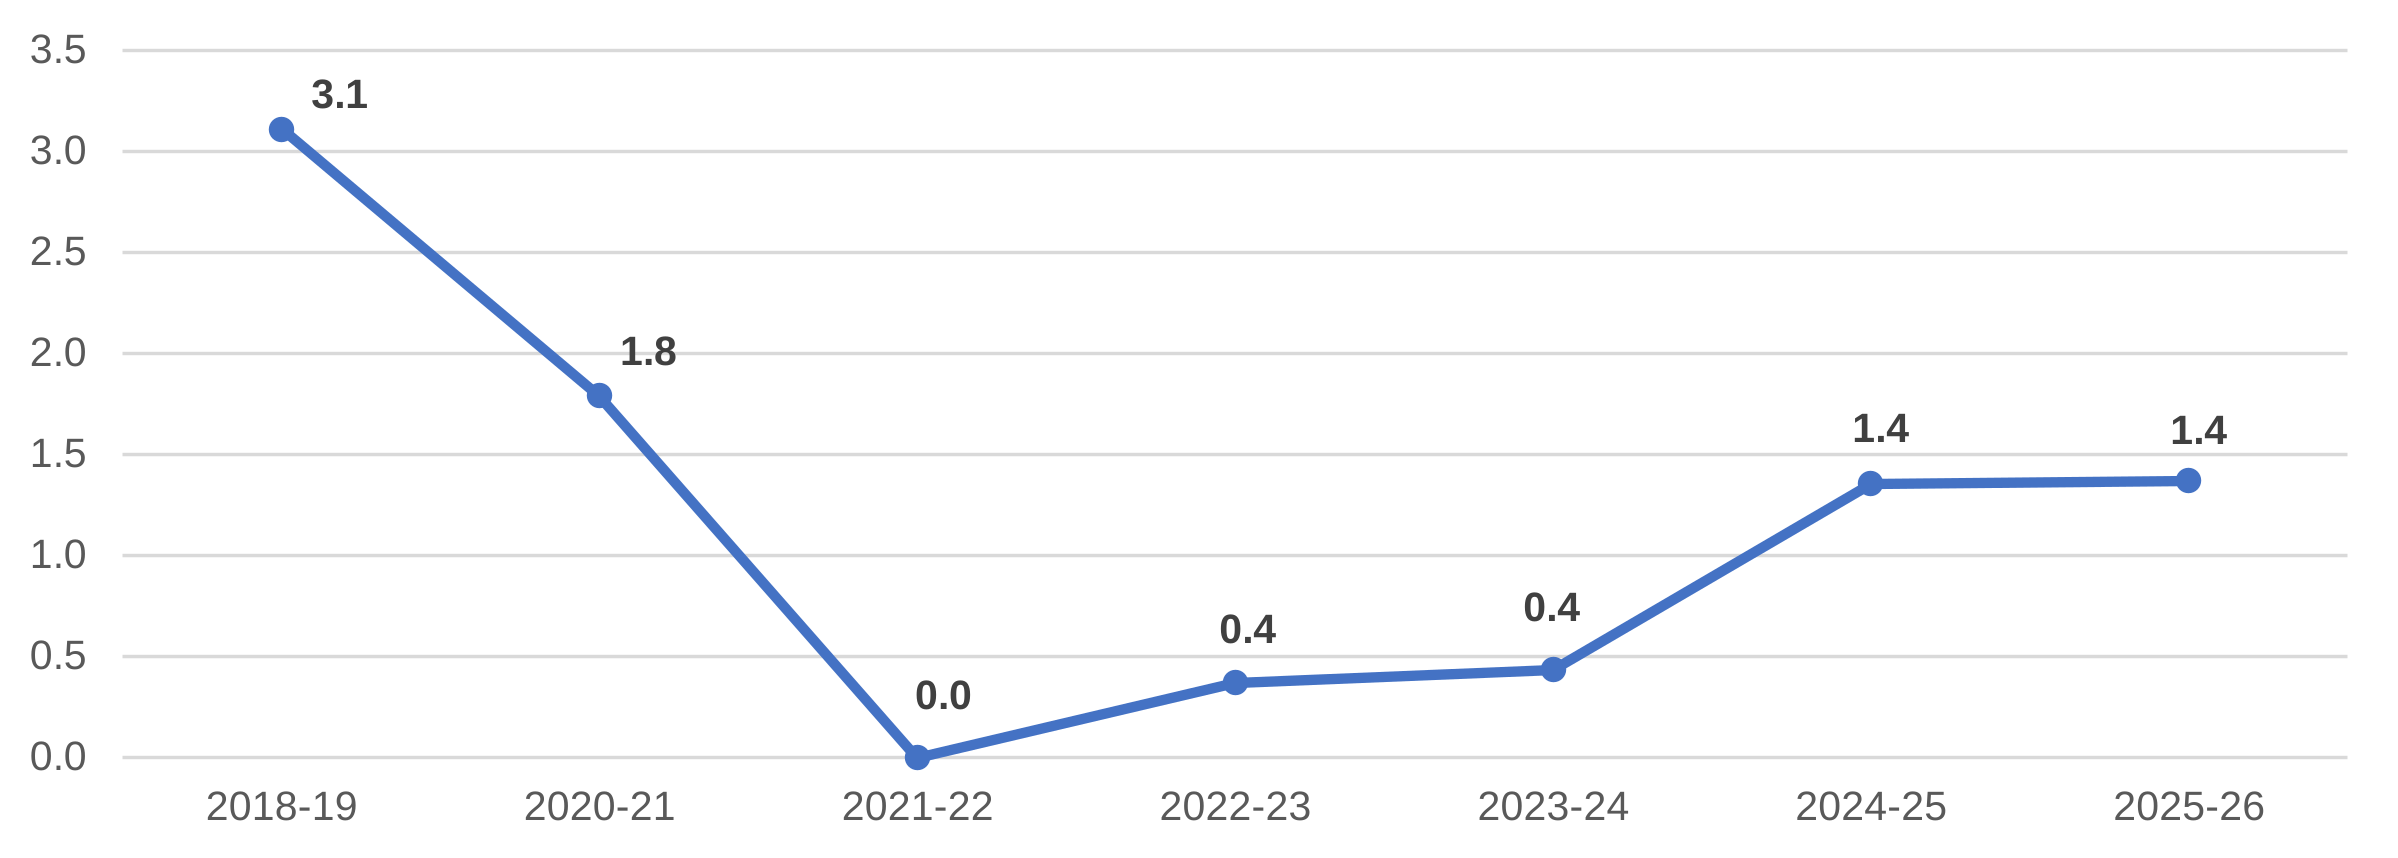
Here is a visual only chart of: Line graph showing the Total Recordable Incident Rate (TRIR) per 200,000 hours worked. The rate in 2025 to 2026 was 1.4, down from 3.1 in 2019. A rate of 0 is the lowest reported rate to date and aligned with the COVID-19 lockdown during the 2021 to 2022 period.
Please find more information provided in the detailed description and/or table below.
| Metric | 2018 to 2019 | 2020 to 2021 | 2021 to 2022 | 2022 to 2023 | 2023 to 2024 | 2024 to 2025 | 2025 to 2026 |
|---|---|---|---|---|---|---|---|
| TRIR per 200,000 hours worked | 3.1 | 1.8 | 0.0 | 0.4 | 0.4 | 1.4 | 1.37 |
TRIR allows a year-on-year comparison of the higher outcome incidents. TRIR takes account of: Lost Time Injury (LTI) cases where a person is unable to come back to work for their following shift, Medical Treatment Case (MTC) which is an injury where treatment was above a First Aid treatment level and Restricted Work Case (RWC) where someone can work but is unable to perform their normal duties.
The TRIR remained static from last year’s rate. This equated to three injuries, the two RIDDOR reportable already discussed and one cut to a finger requiring medical sutures.
The commitment to incident management remains paramount, ensuring incident information is promptly reported, enabling timely investigations, and the implementation of effective corrective actions and the communication of lessons learnt. In the year ahead FSS will look to introduce an online safety observation and incident reporting and investigation software to improve the efficiency of reporting health and safety issues.