- Pathogen testing in water is generally performed as presence/absence, due to low pathogen concentrations that defy accurate quantification.
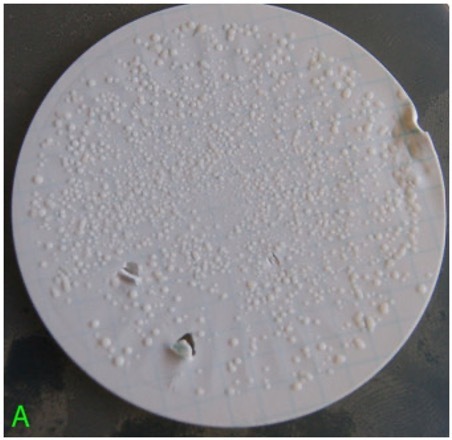
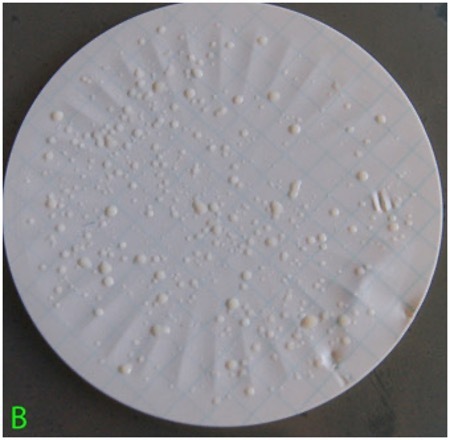
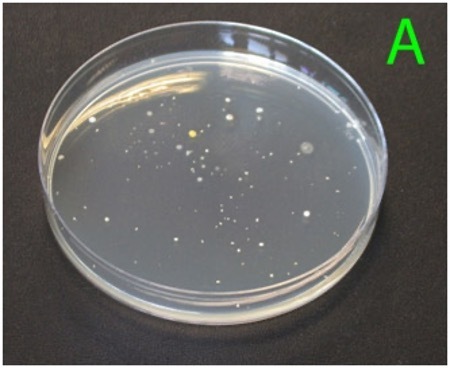
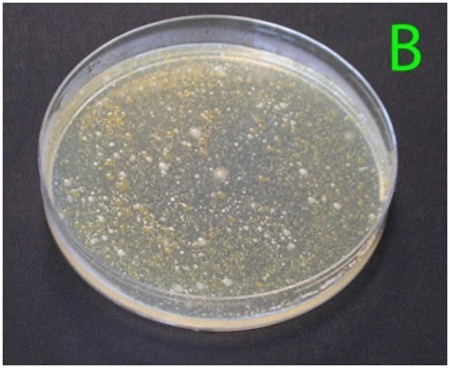
- Test methods include membrane filtration, most probable number (MPN) determination, and direct plating methods.
- Test results should be tracked over time using the same lab and method for valid comparison.
- If indicator results exceed your limits, suggested actions include:
- maximising the interval between last irrigation and harvest
- switching water sources
- changing irrigation methods
- treating the water before use.
Human pathogens commonly linked with irrigation water are mainly enteric bacteria, which originate in the gut and spread in the environment via livestock and wildlife faeces. Examples include Campylobacter, Salmonella, and Escherichia coli O157. Though not strictly enteric, Listeria monocytogenes, is also significant; it is found ubiquitously in soil, water, and manure (1). Because it thrives in refrigeration temperatures and has a high fatality rate (~35%), it is treated with special caution in post‑harvest hygiene monitoring.